
 2021 brought a variety of weather to the Texas South Plains. A brief, but impressive weekend snow in mid-January was followed by a record-setting Artic air outbreak in mid-February, while the year ended with a record warm December! Between the cold start and warm end, we had an early outbreak of tornadoes in mid-March, a stormy late spring and summer - lasting into the early fall. The rain became scarcer in late fall though, and by the end of the year drought conditions had worsened across much of the area. Altogether, the year ended as the 13th warmest on record in Lubbock, finishing with an average yearly temperature of 61.9 degrees. Annual precipitation totals were a bit of a mixed bag across the South Plains region, but Lubbock officially recorded 20.55 inches, making 2021 the 38th wettest in the historical record. 2021 brought a variety of weather to the Texas South Plains. A brief, but impressive weekend snow in mid-January was followed by a record-setting Artic air outbreak in mid-February, while the year ended with a record warm December! Between the cold start and warm end, we had an early outbreak of tornadoes in mid-March, a stormy late spring and summer - lasting into the early fall. The rain became scarcer in late fall though, and by the end of the year drought conditions had worsened across much of the area. Altogether, the year ended as the 13th warmest on record in Lubbock, finishing with an average yearly temperature of 61.9 degrees. Annual precipitation totals were a bit of a mixed bag across the South Plains region, but Lubbock officially recorded 20.55 inches, making 2021 the 38th wettest in the historical record.The graphic below highlights some of the more significant weather events that occurred across the area in 2021. The first month of the year provided a decent shot of snow on the 10th, including around a half foot in Lubbock, followed by a severe storm late in the month that generated golf ball size hail, killing many waterfowl over southern Lynn County. Mid-February brought the arctic chill, complete with periods of light snow. Winter quickly transitioned to spring the next month when a powerful storm system emerged over the southern High Plains, generating severe thunderstorms that produced tornadoes during the middle of the month. Interestingly, the bulk of tornadoes for the entire year (10 of 18) occurred in mid-March. More regular bouts of thunderstorms, some strong to severe, affected the region through the heart of spring, especially from mid-May into June. Although a few storms produced localized damage, widespread beneficial rainfall helped to ease the drought conditions. Periodic rains, occasionally heavy, persisted through the summer, eliminating the drought across the region and much of the state by late summer. The relatively moist summer also helped to keep temperatures in check through the hottest part of the year, and both July and August finishing on the cool side of average. The regular rains failed by late fall into the winter, with only a few days of measurable precipitation observed. The dry end of the year brought a return of the drought, along with several windy and dusty days. December escaped without any intrusions of bitterly cold air and easily finished as the warmest December on record regionally and for the entire state of Texas.
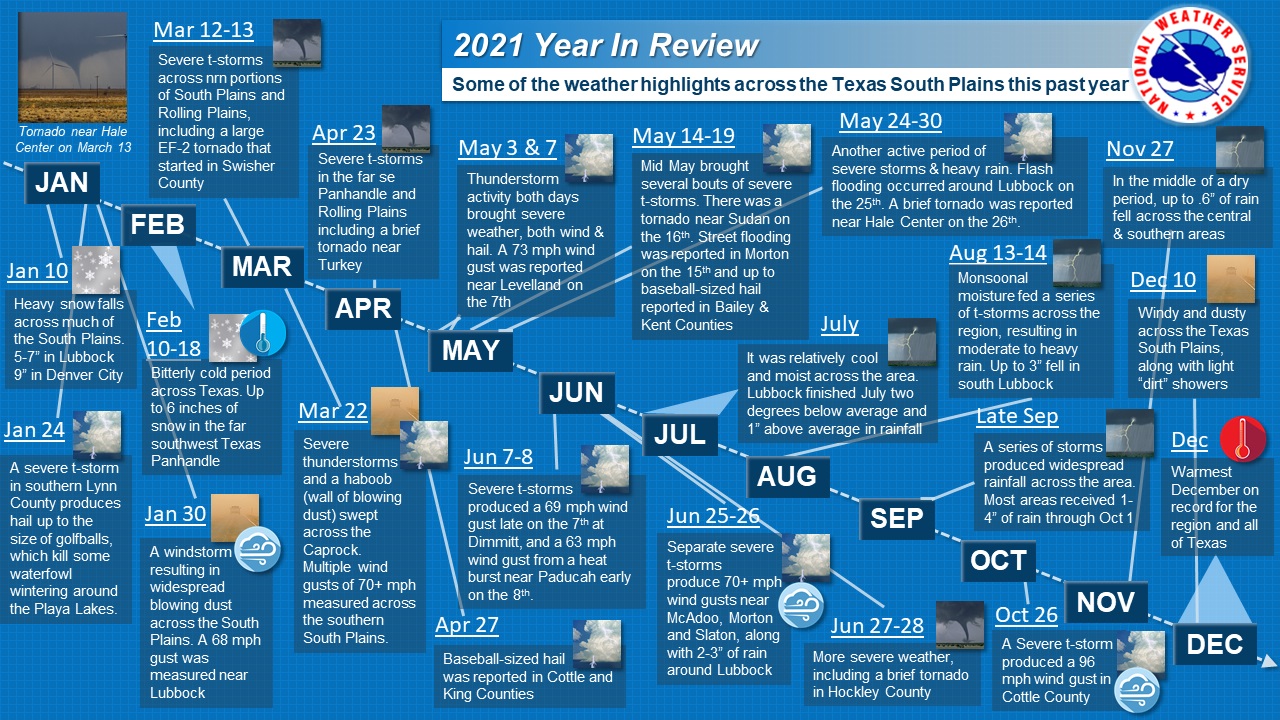 Outline of notable weather impacts to the region in 2021. Note that this is just a sampling of events, many more have been omitted due to space constraints. Click on the image to view a larger map.
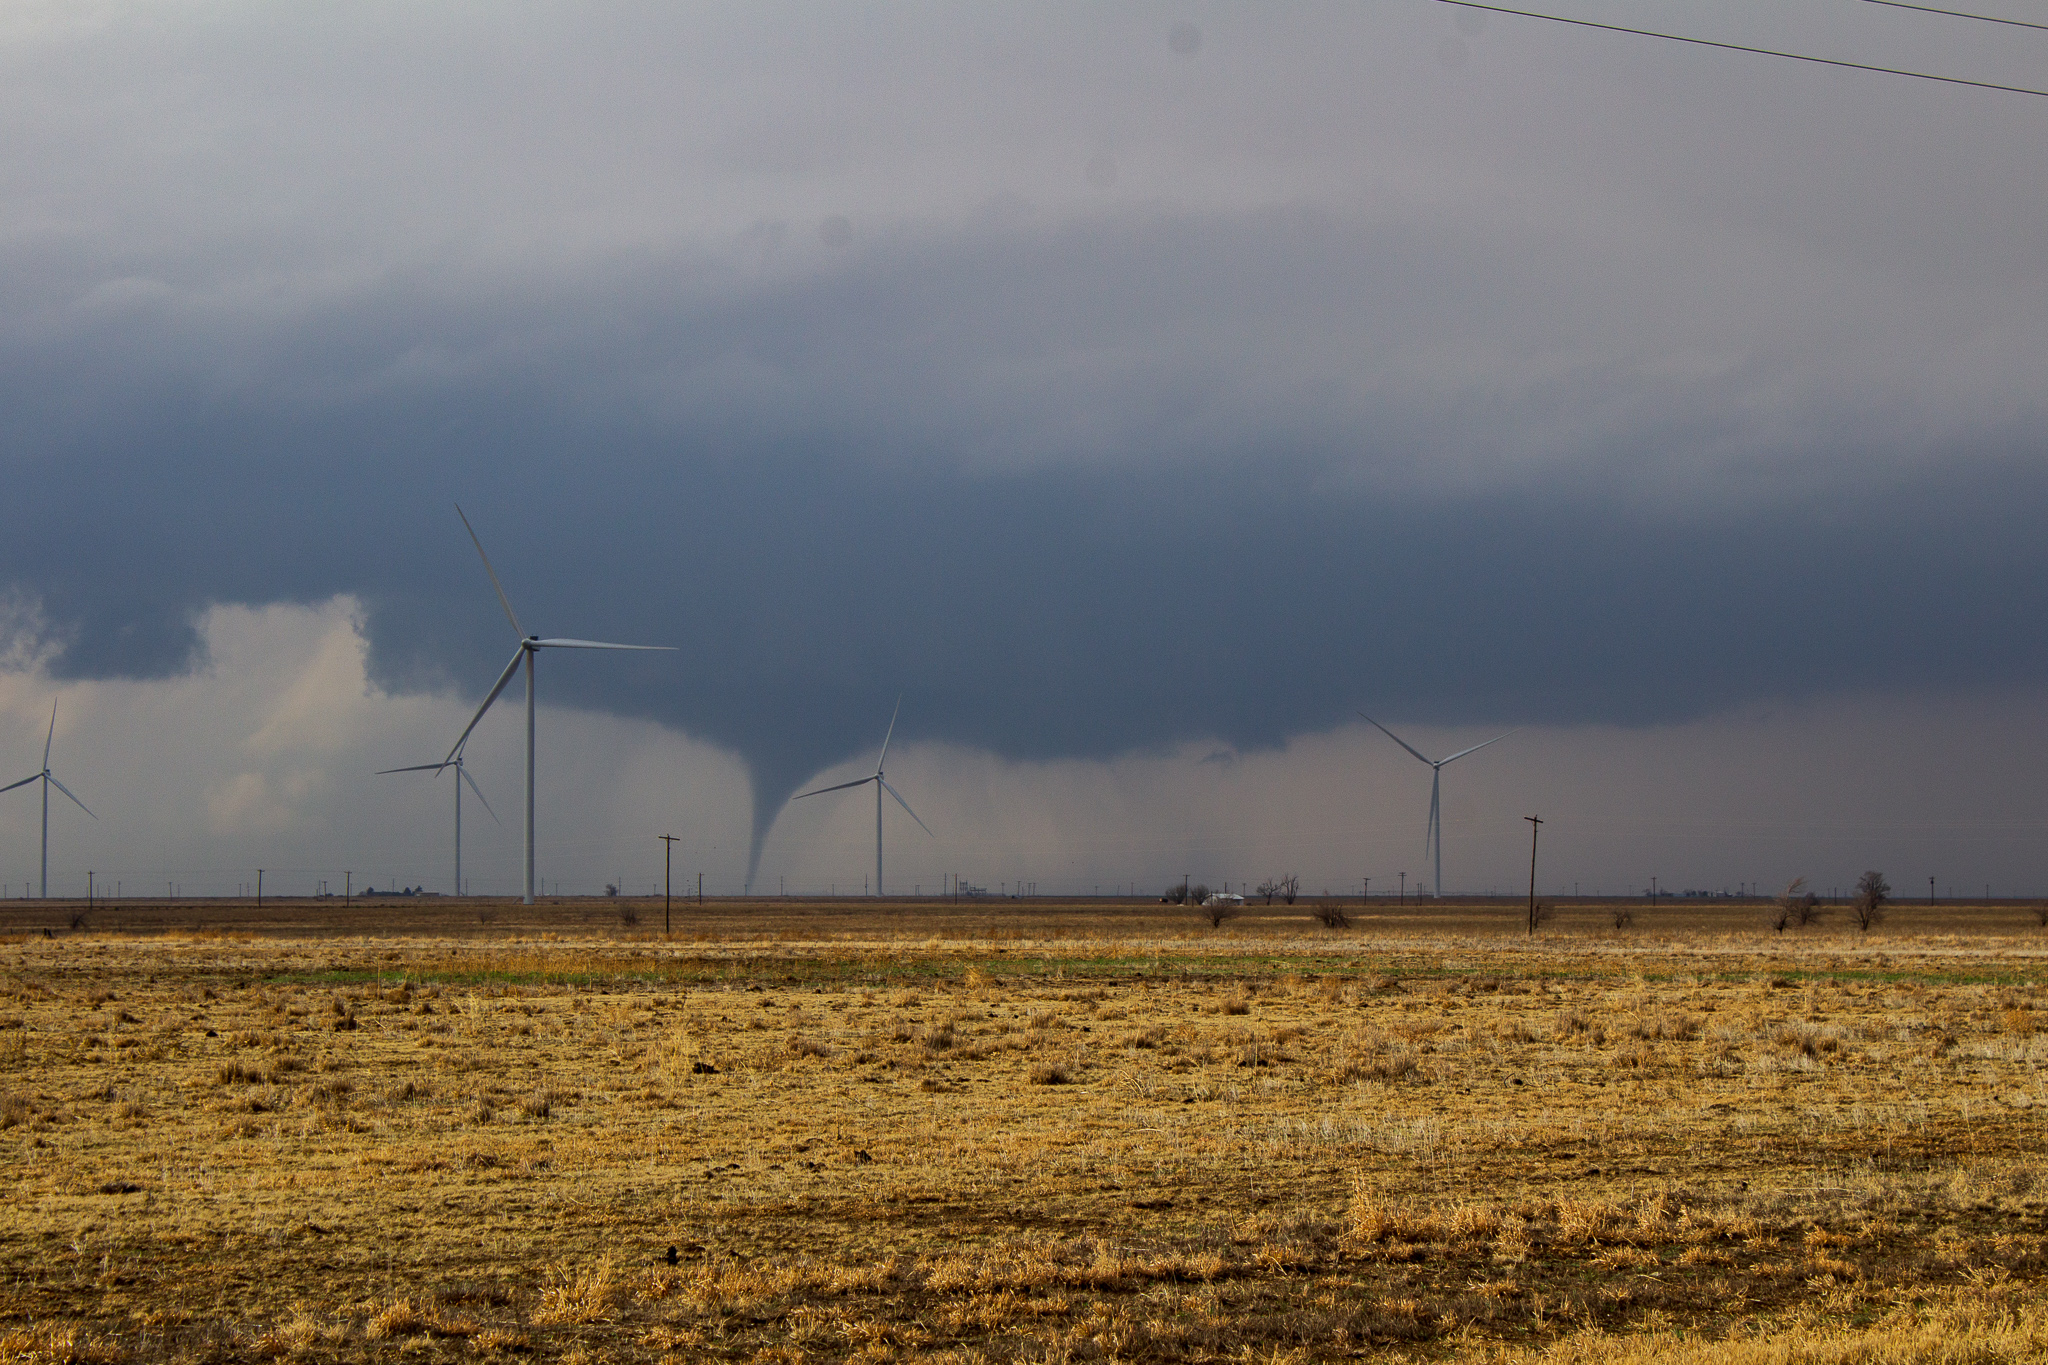
Eighteen (18) tornadoes, including at least 3 landspout-type tornadoes, were documented in the Lubbock 24-county service area in 2021, well above the 4 observed the previous year, and in line with long-term average of 18. The majority of tornadoes (10 of 18) occurred with a powerful storm system that moved across the southern High Plains in mid-March. Eight tornadoes occurred on March 13th, including the only tornado within the Lubbock County Warning Area (CWA) that obtained a rating higher than an EFU or EF0 in 2021. An EF1 rating was assigned to a tornado that developed west-southwest of Happy and grew into a wide and long track tornado as it moved northeastward. The tornado damaged mainly power poles and a few structures in Swisher County, acquiring the EF1 rating. The tornado did go on to obtain an EF2 rating in Amarillo's CWA, as it caused significant damage as it tracked all the way to Palo Duro Canyon State Park. May and early June, typically the peak for severe weather on the South Plains, only brought 2 tornadoes. One strongly rotating storm passed across the southern portion of Lubbock the evening of May 17th. This storm produced a brief tornado over open land west of Wolfforth, but thankfully did not generate any additional tornadoes as it moved eastward.
|
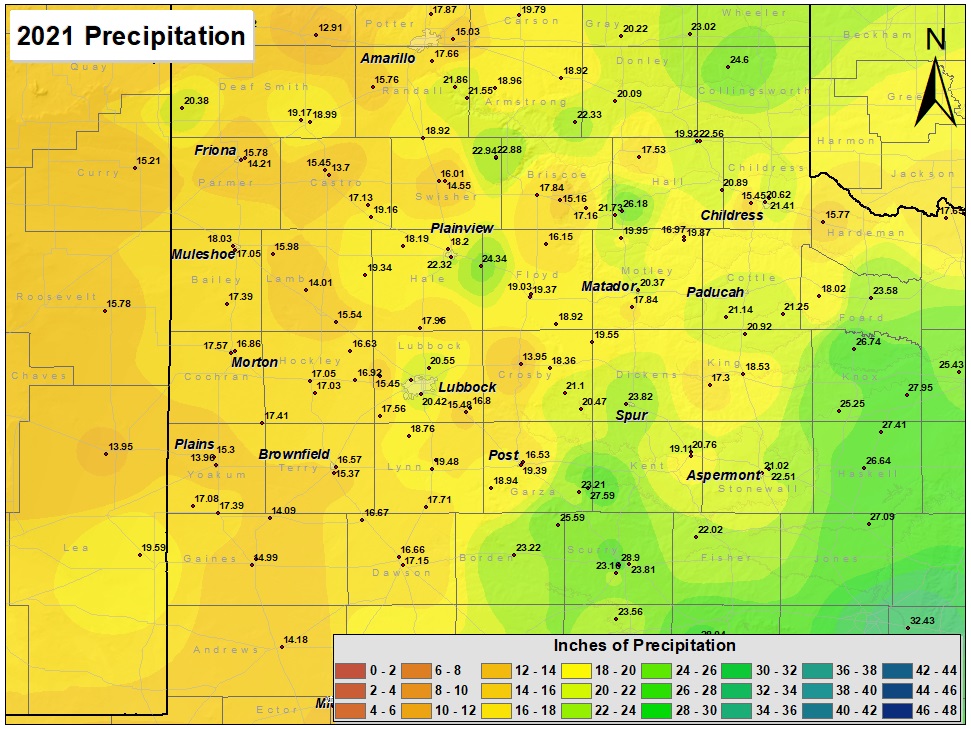
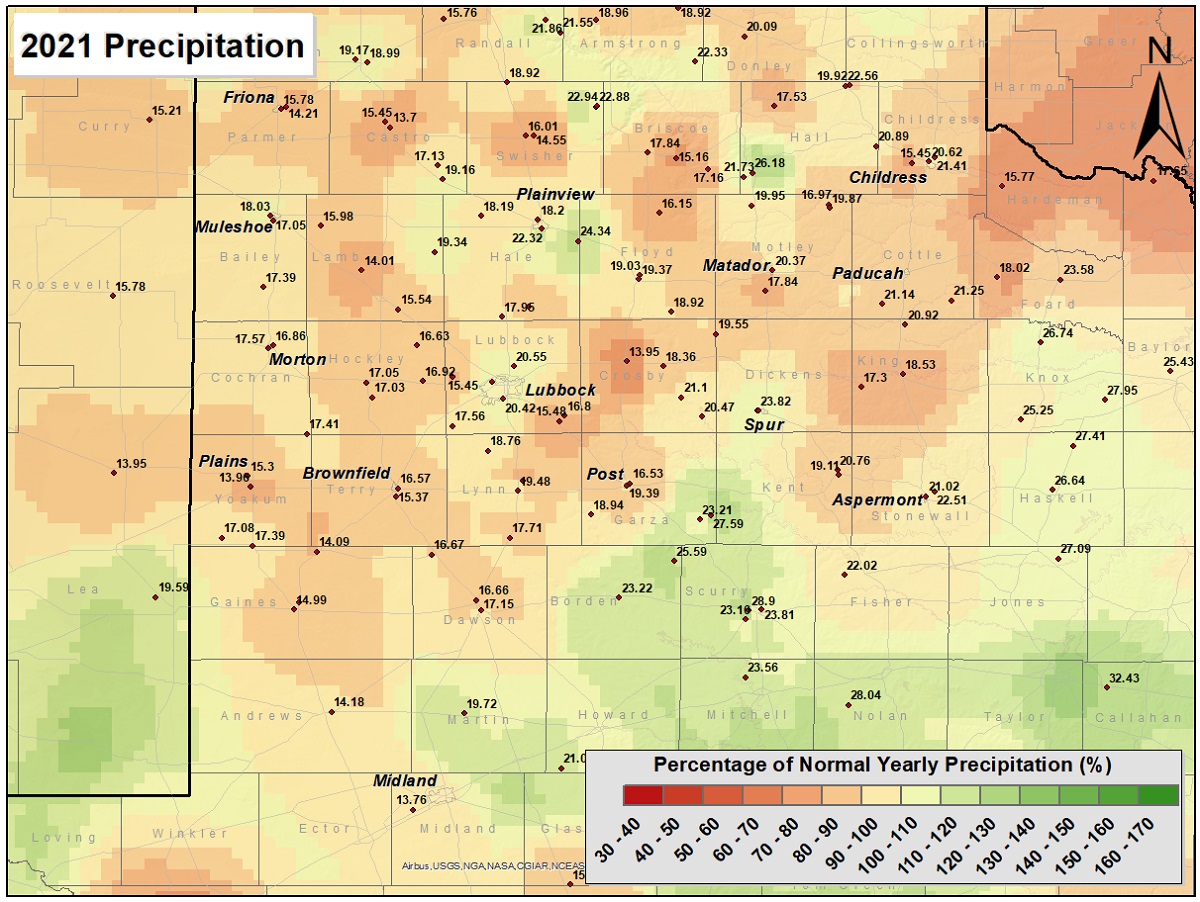
Precipitation in 2021 was more abundant than 2020, and generally increased from west-to-east, as is typically the case over the longer term. Rain totals of 15 to 20 inches were common across much of the Caprock, with a few pockets in excess of 20 inches near Lubbock, Plainview and Vigo Park. Rain was fairly evenly distributed over the southwest Texas Panhandle and western South Plains, where 12-month totals were commonly near 15 inches, plus-or-minus a couple of inches. The lowest rainfall tallied within the NWS Lubbock Forecast Area was 13.70 inches near Dimmitt. Further east, yearly rainfall was a bit more varied, and commonly ranged from 15 to 25 inches. The Childress Airport, located west of town, was on the lower side, officially measuring 15.45 inches, well below the average of 23.67 inches. However, in town rain totals were 5 to 6 inches greater. The highest annual rain totals were found around Turkey, Spur and Lake Alan Henry where around 2 feet or more of rain was tallied in 2021. Lubbock International Airport officially recorded 20.55 inches of precipitation, exactly 9 inches more than 2021 and over 2 inches above the long-term average of 18.33 inches. The map below shows the 2021 precipitation as a percent of the long-term average, or "normal". A majority of the South Plains region finished the year near to below average, with a few pockets on the positive side of average. The driest pockets were scattered relatively evenly across the South and Rolling Plains, while the spotty above average totals generally resided near the edge of the Caprock.
|
|
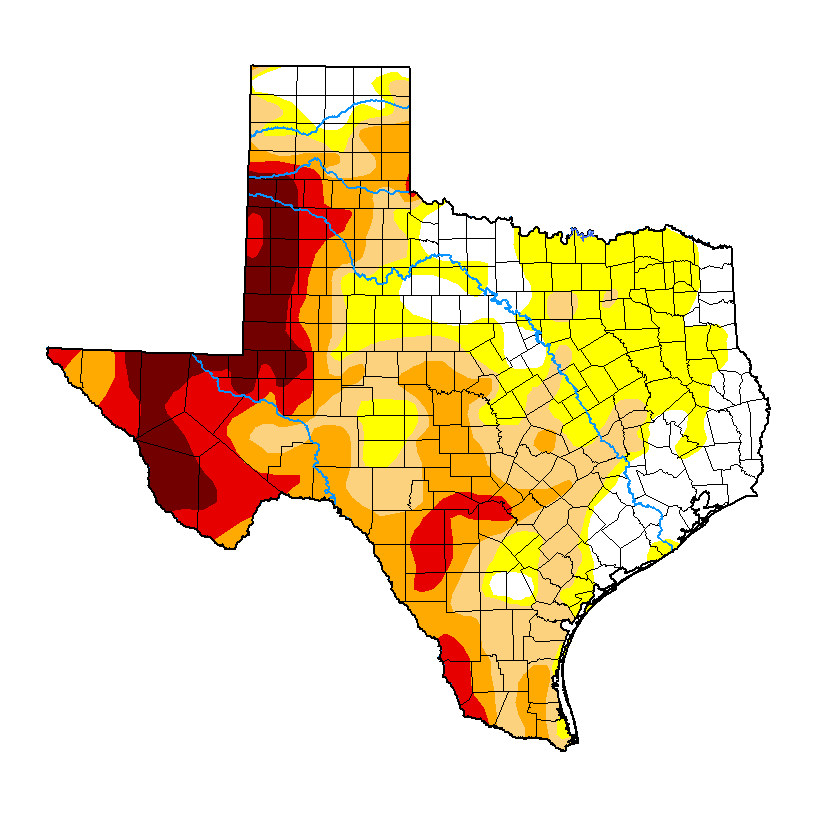
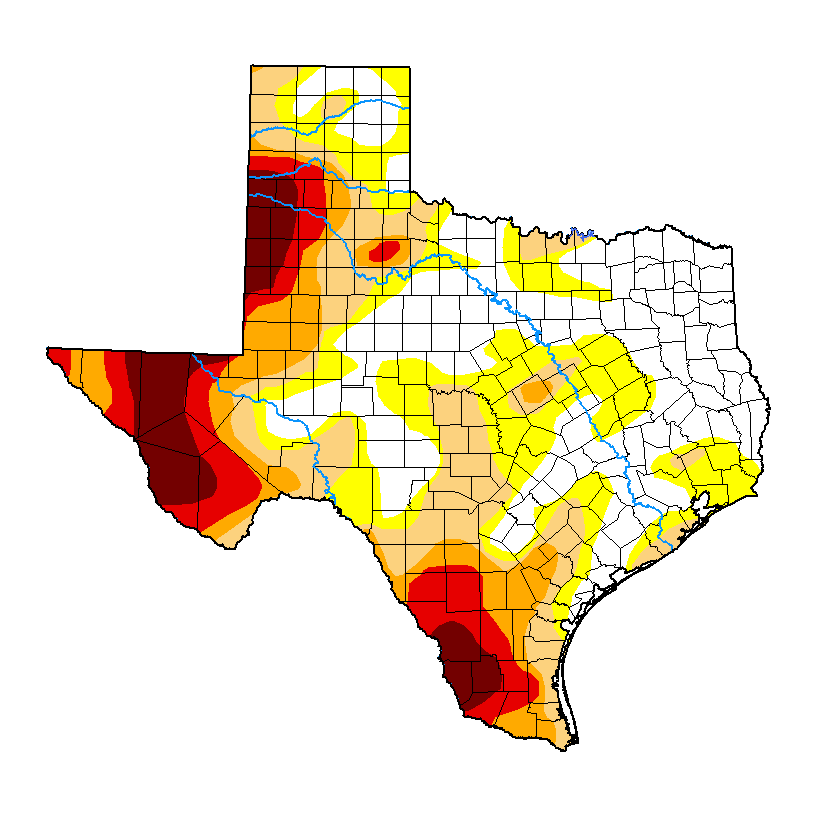
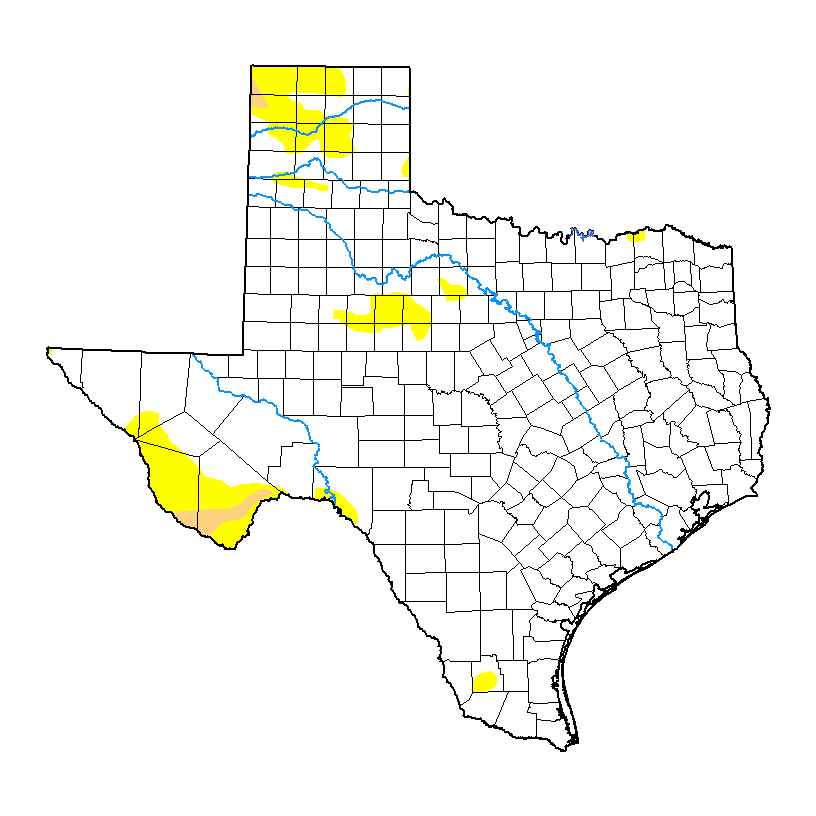
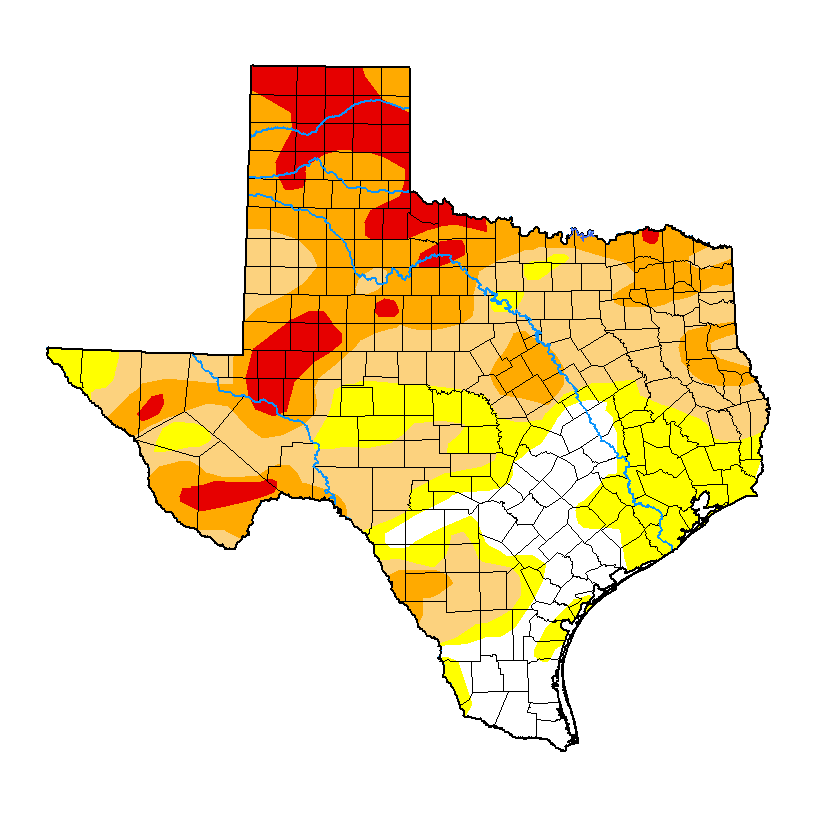
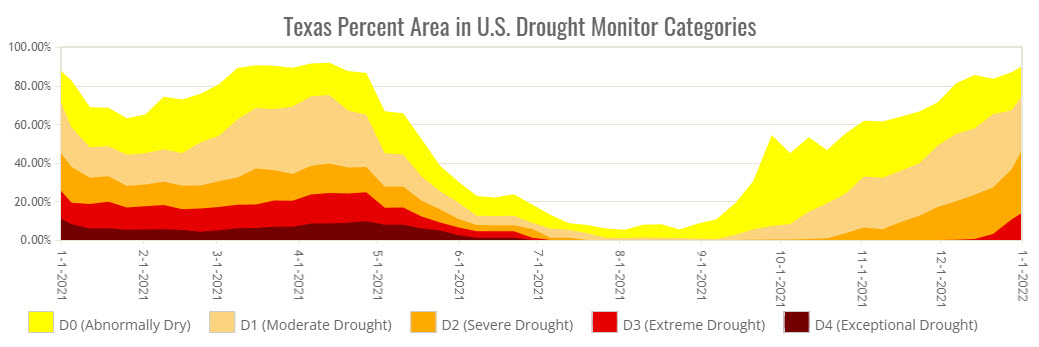
The year began with extreme to exceptional drought across the central and western South Plains, the southwest Texas Panhandle and much of Far West Texas. Only minor adjustments to the drought occurred over western Texas through early May. However, more frequent and heavy precipitation followed through late May and into the summer, essentially eradicating the drought. Unfortunately, dry conditions returned to much of the state the final months of the year, resulting in the reemergence of drought for a good chunk of Texas. This included the redevelopment of severe to extreme drought for much of northwestern Texas.
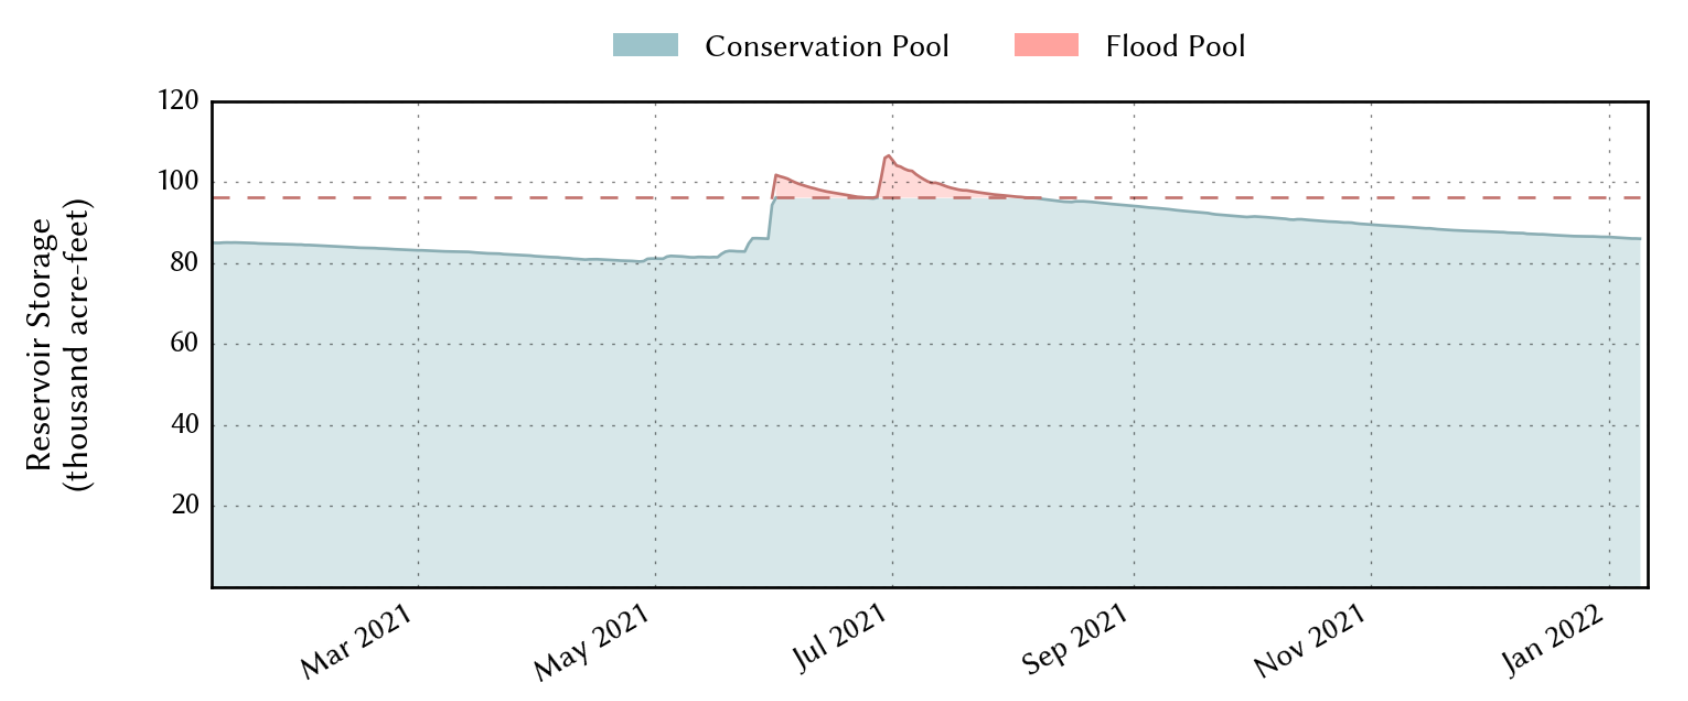
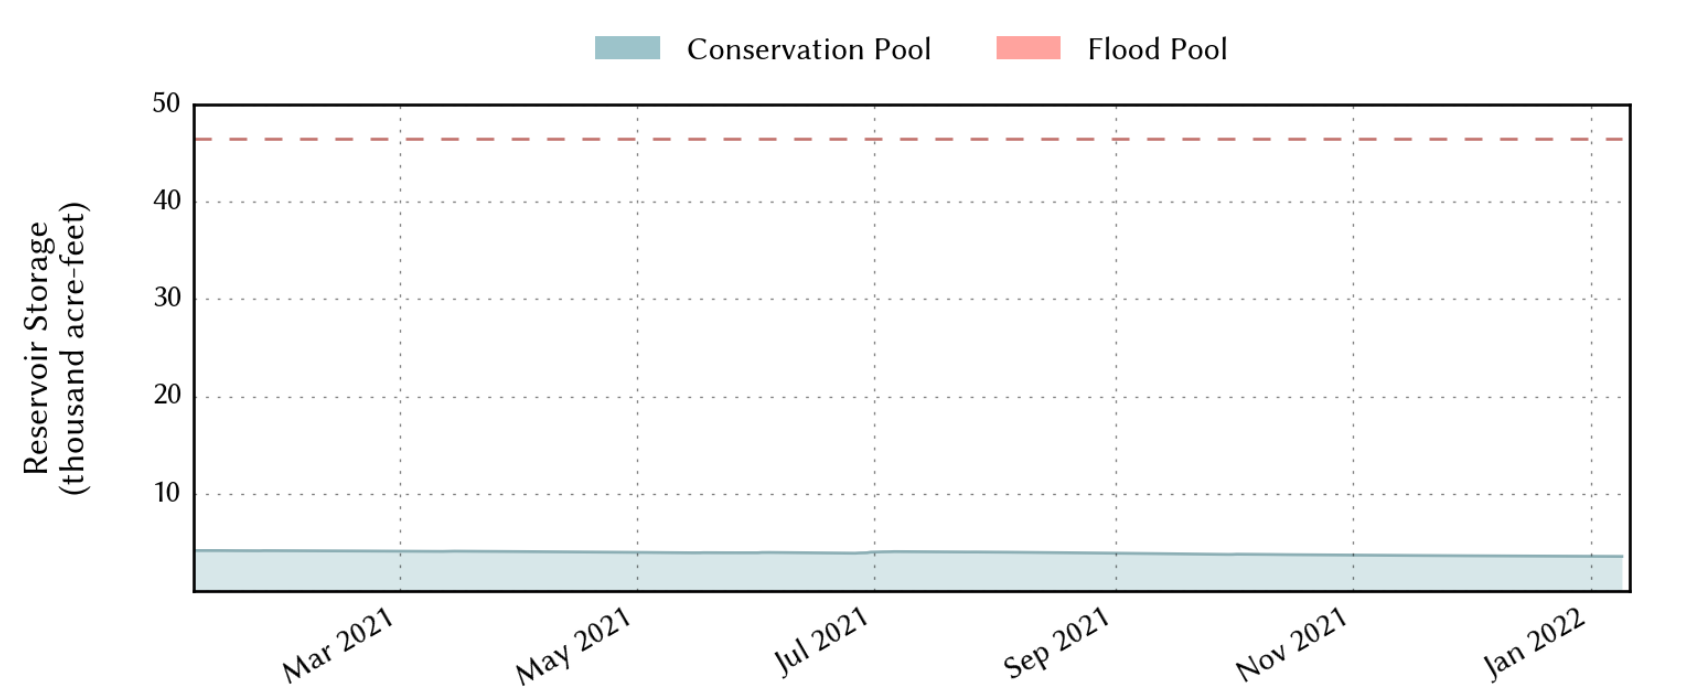
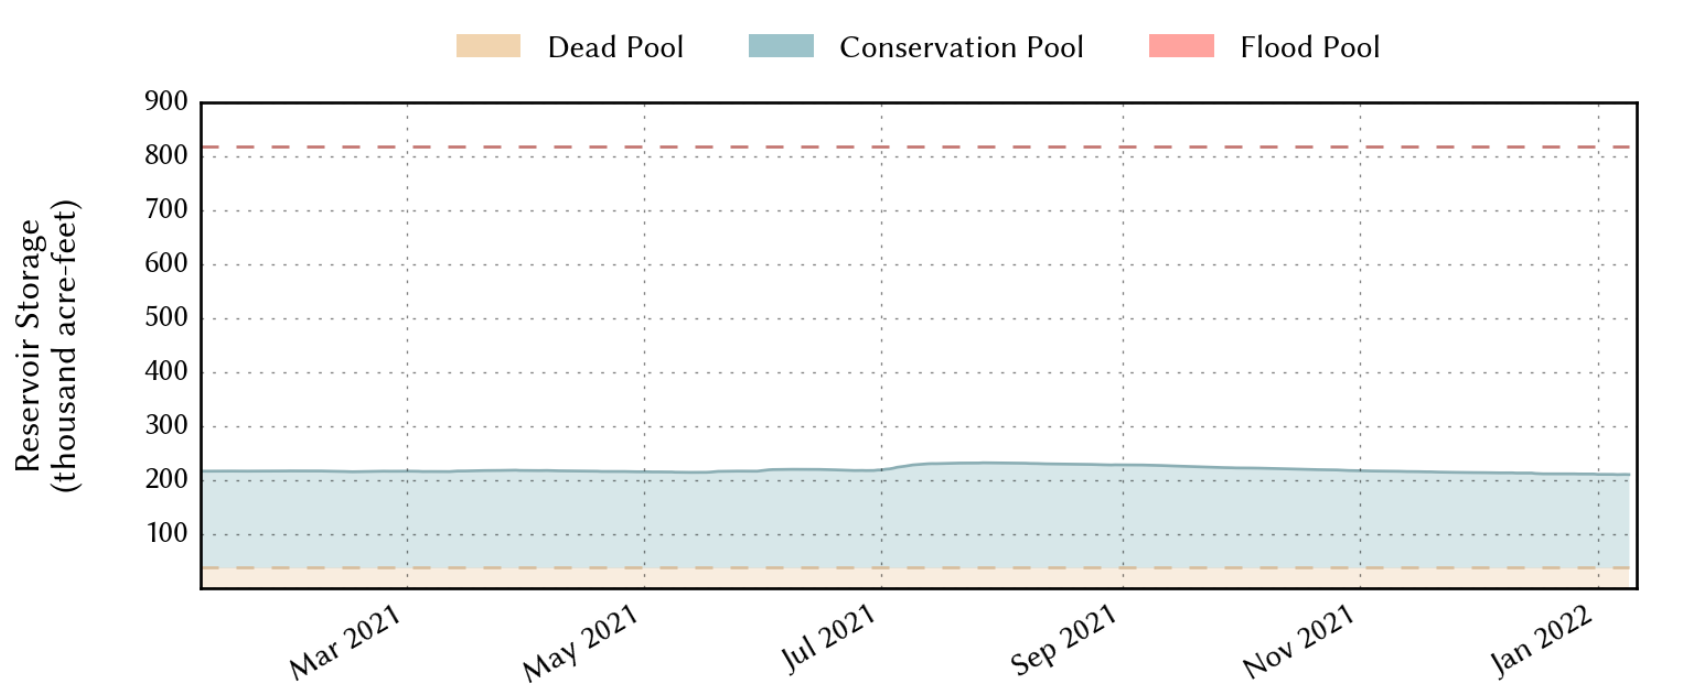
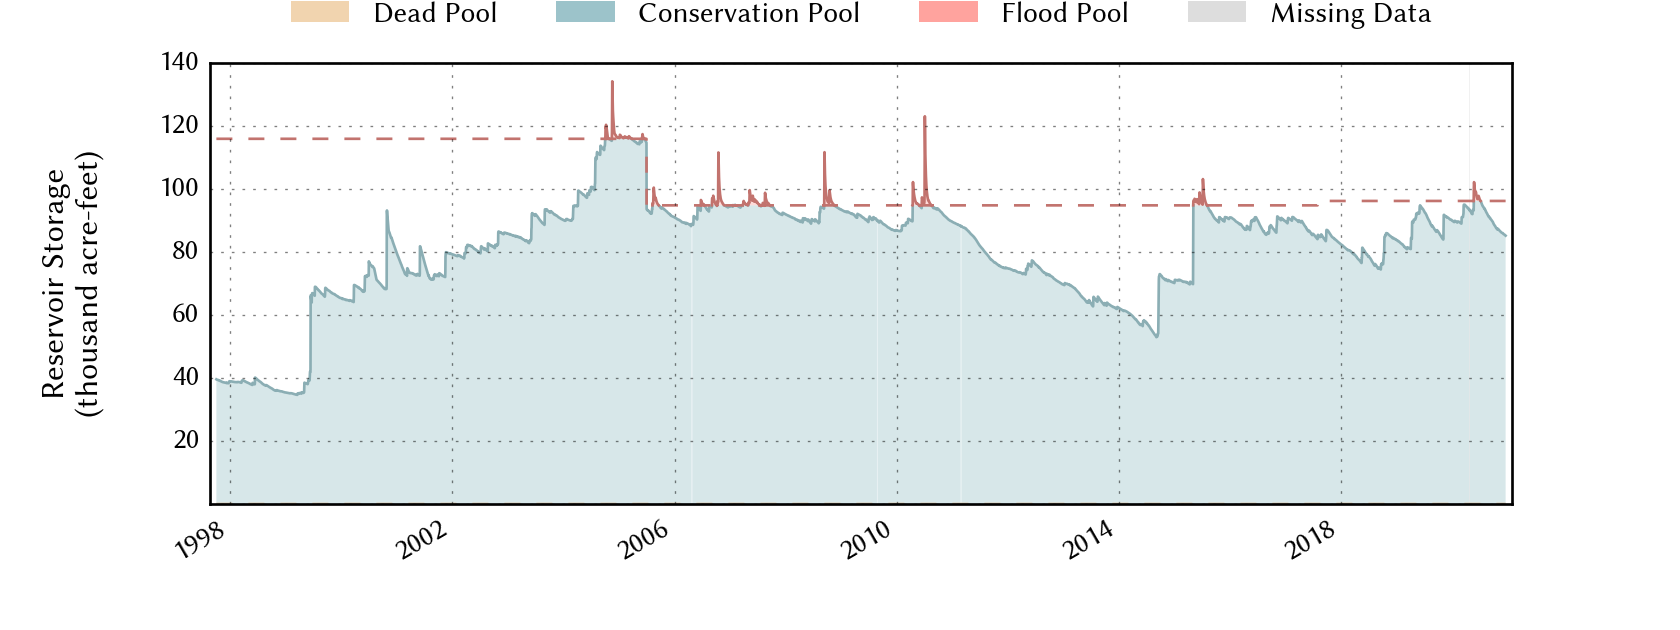
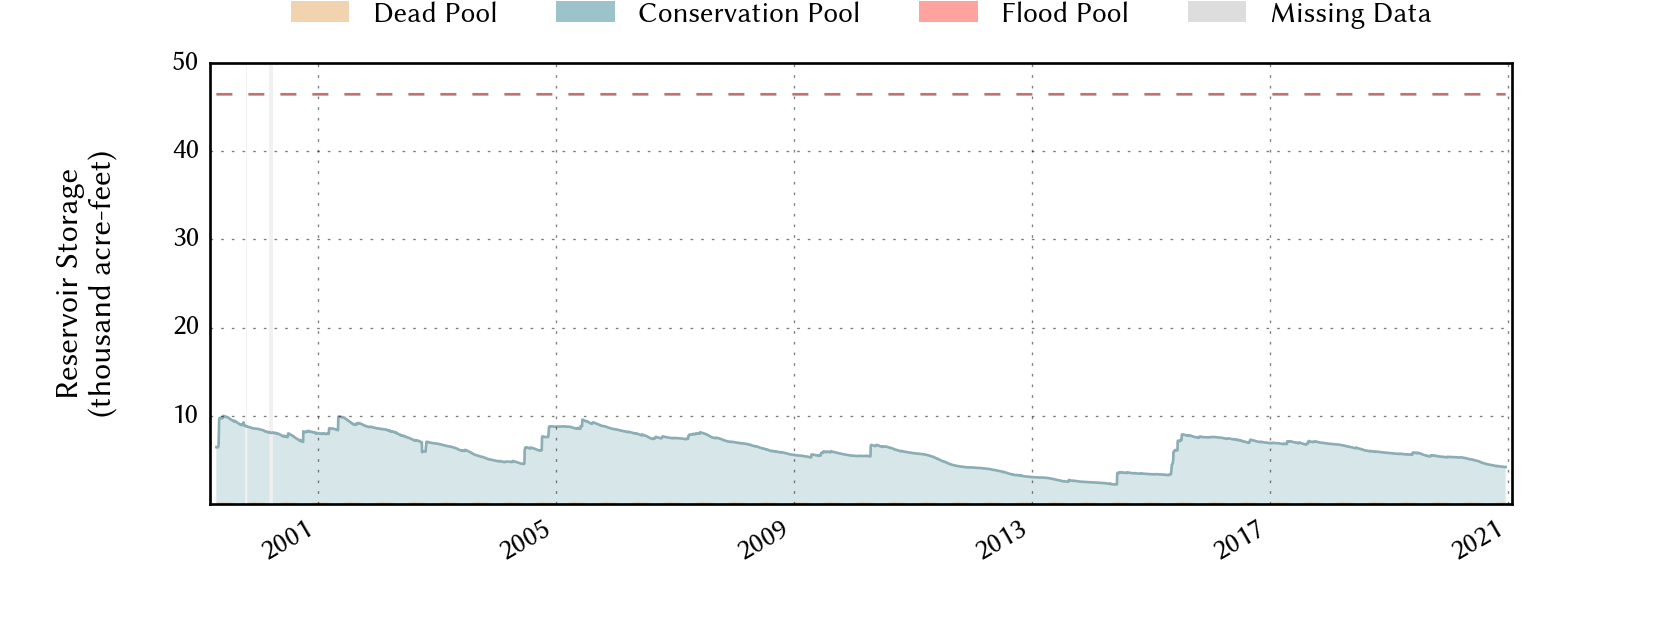
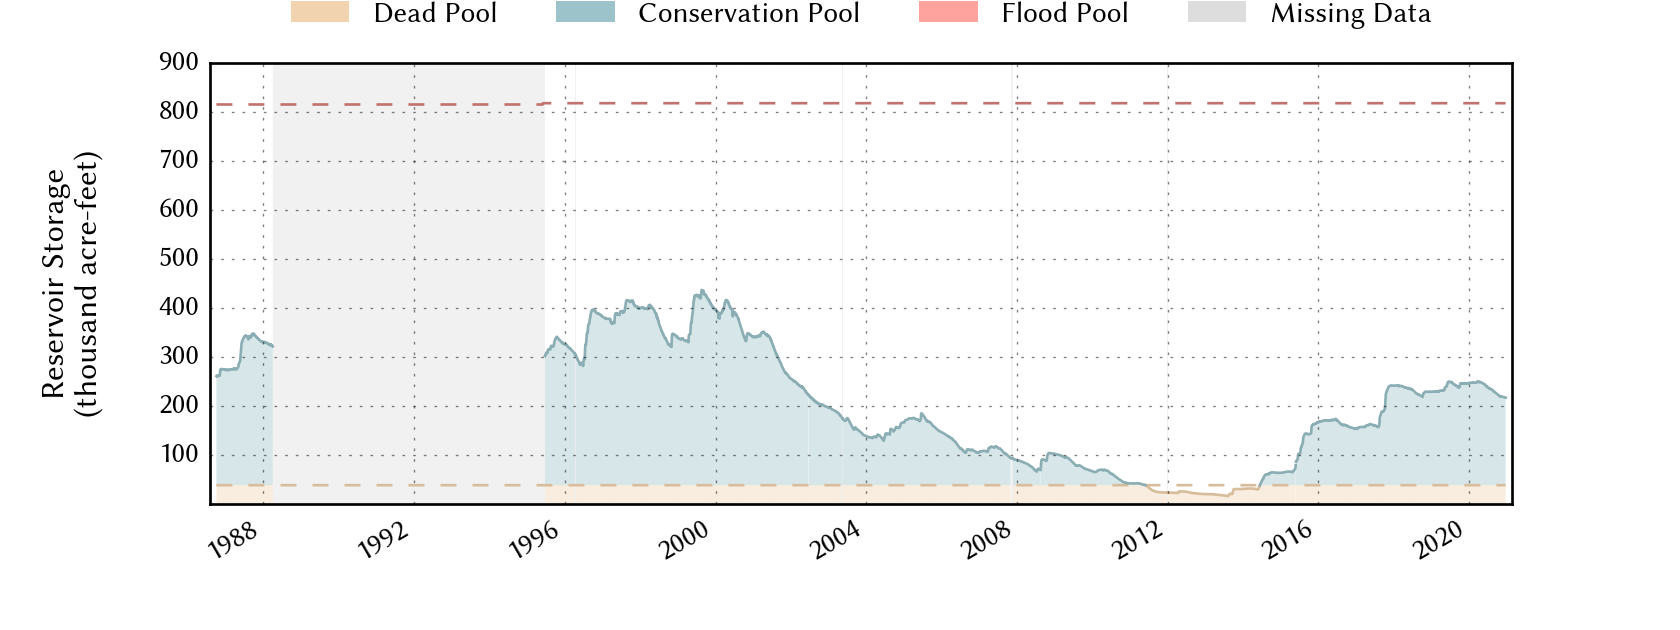
The area reservoirs responded to the relatively regular, occasionally heavy, rains through the middle part of the year, causing levels to rise mid-2021. The greatest rises were observed between late May and early July. The lack of rain through the latter part of 2021 caused a general decrease in reservoir levels to conclude the year. Lake Alan Henry did fill and run over the spillway through much of May and June, but dropped steadily to end the year where it began at 89% full. The relative dry start to 2021, extremely dry end, and wet middle of the year resulted in a mixed bag with regards to net area reservoir level changes. Over the course of the entire year the conservation level at Lake Meredith fell from 36% to 34%, Lake Alan Henry started and finished at 89%, White River Lake rose from 12% to 19% and Lake Mackenzie fell from 9% to 8%.
|
||||||||||||||||||||
|
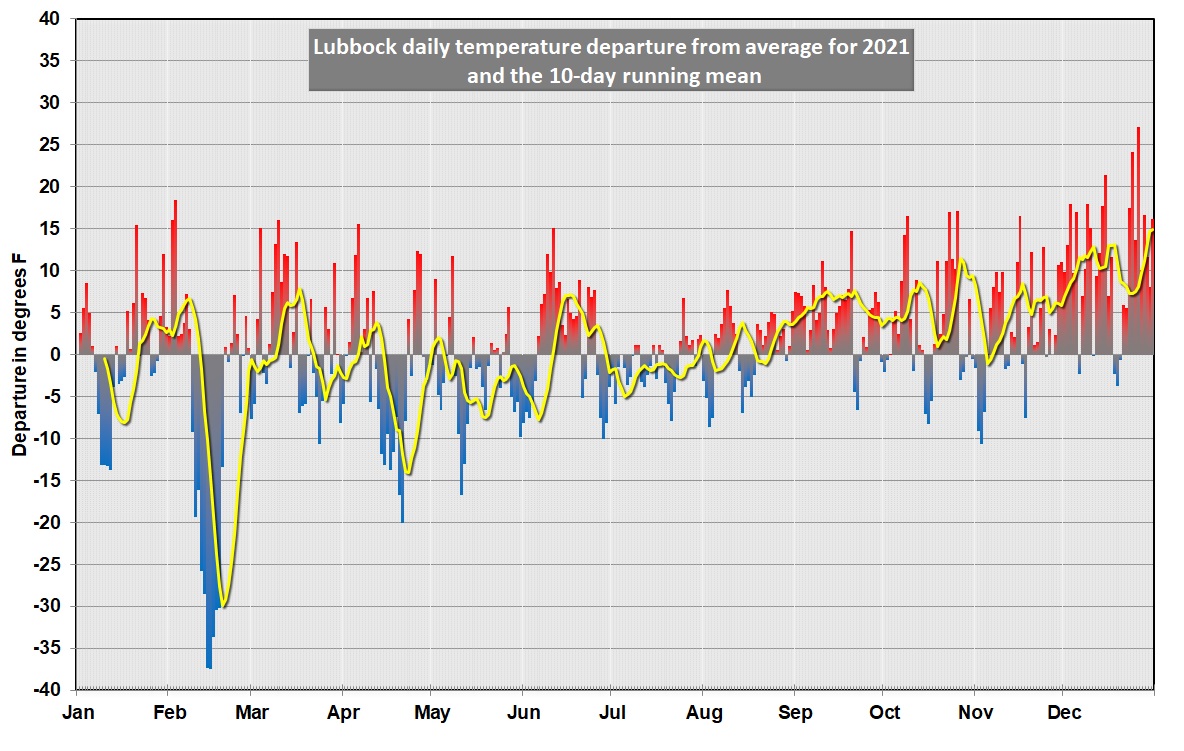
2021 will go down in the books as the 13th warmest and 38th wettest year since records began in 1911 at Lubbock. Mean monthly temperatures were warmer than average for 7 months and cooler than average 5 months (February, April, May, July and August). The warmest month, with respect to average, was December which finished an incredible +9.9°F over average. December's average temperature of 51.6°F shattered the previous warmest December on record (48.0°F in 1933). The coolest months, with respect to average, was February (-7.7°F), which was the third coldest February on record behind 1978 and 1929. The remainder of the months finished within 4°F of average.
After a dry 2011, sporadic rain and snow kept precipitation totals near average through the first few months of the year. April and early May were dry, but thankfully precipitation came more regularly and abundantly from the second half of May through much of the summer. The fall and early winter turned firmly dry, with only a few light precipitation events. Altogether 5 months finished with above average precipitation, including an impressive 5.86 inches in May (3.17 inches above the monthly average). The driest month was April, when a meager 0.19 inches of rain fell. Five other months saw less than one inch of rain, including the final four months of the year. The year saw 11.4" of snow fall at Lubbock, boosted primarily by 7.6" that fell on January 10th. February brought nearly 4" inches of snow during a bitterly cold stretch mid-month. No snow fell during the end of 2021, though a brief burst of snow did impact Lubbock New Year's Day 2022. The Lubbock Airport recorded a total of 20.55 inches of precipitation for 2021, finishing 2.22 inches above average. Seven days recorded an inch or more of rain, including a peak of 2.00 inches on May 24th.
The hottest temperature in 2021 was 108°F, reached on June 11th. In all, temperatures reached the triple digits on 6 occasions, well down from the 29 times it happened in 2020, and below the long-term average of 10 days. On the other side of the pendulum, the coldest temperature of the year was a bitterly cold 0°F, experienced February 14th and 15th during a widespread Arctic outbreak that crippled Texas. Twelve nights fell below 20°F for the entire year.
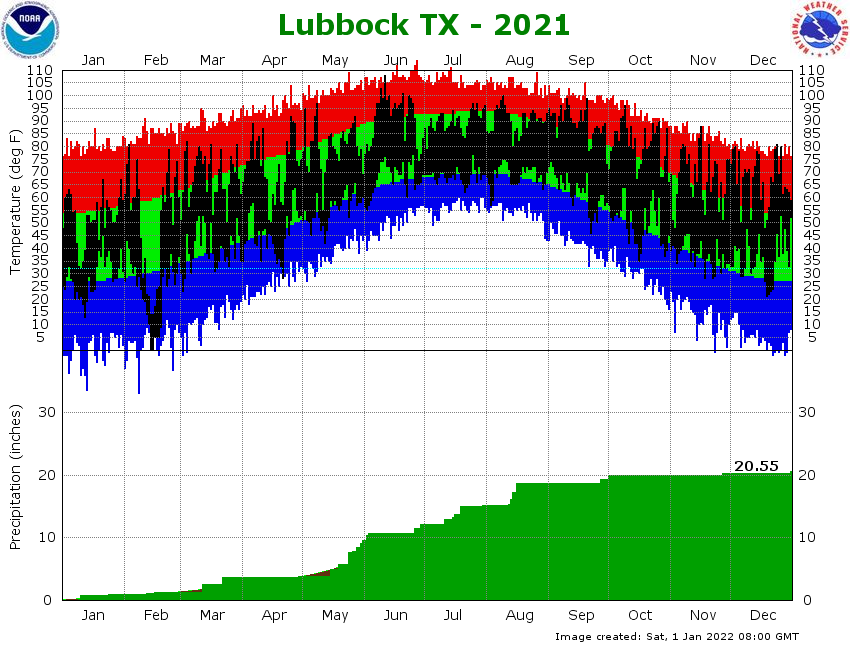
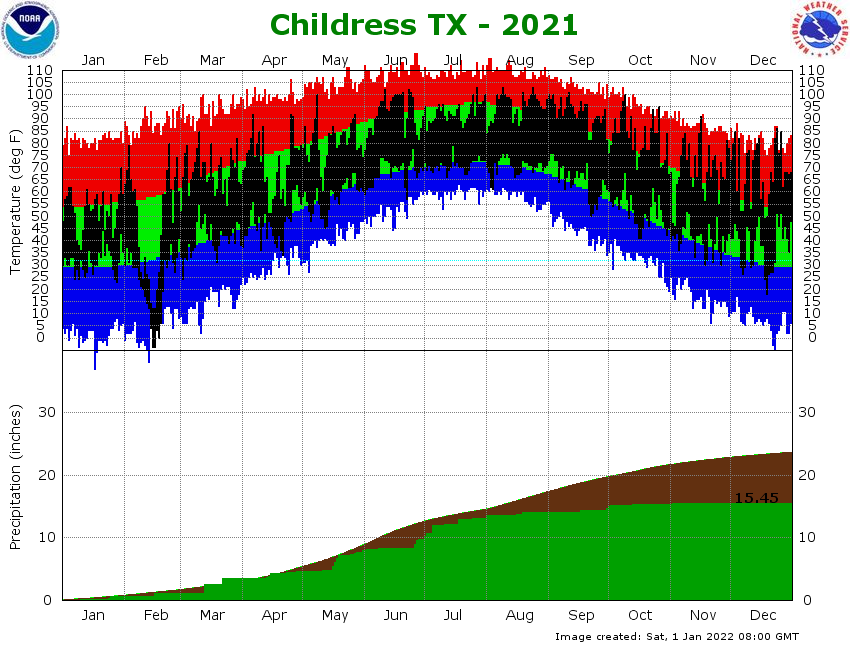
The upper section of the below graph shows the daily high and low temperature distribution for 2021 at Lubbock Preston Smith International Airport. The first 5 months showed a lot of variability, including several well-below average stretches punctuated by the extreme cold that invaded the region in mid-February. The hottest temperatures of the year favored June, which is rather typical. The second half of the year was dominated by near and above average temperatures, concluding with a record "warm" December.
The bottom section of the chart above shows how much rain accumulated through 2021. Lubbock finished with a grand total of 20.55 inches, just over 2 inches above the 30-year average. The year began on an unsettled note, with several bouts of rain and snow through mid-March. In response, precipitation totals were running slightly above average through March. Thereafter, rainfall nearly ceased for a couple of months, before returning in earnest the second half of May. Periodic rainfall then continued through most of the summer, but nearly shut off, aside from a few minor events, during the fall and early winter.
|
|
|
| JANUARY through DECEMBER |
